For the group presentations, I’ve been working with the tool Voyant, which does text analysis on one or more documents. Among its tools, it generates a word cloud of most frequent words, generates graphs of word frequency across the corpus, and lets you compare multiple documents. Once you have a text uploaded, you can play around a lot within the Voyant “skin”, opening and closing different tools, or clicking on a particular word to see trends for that word specifically. It’s also possible to generate a link to the skin that can then be shared with others, allowing them to then play around with the data on their own. I think this interactive feature could potentially be really useful, since it lets anyone who is curious take a look at the data and track key words in pursuit of whatever questions they might be interested in.
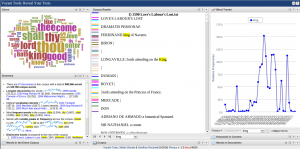
Just as an example of what using the Voyant tools looks like,![]() this screenshot shows Shakespeare’s works (Voyant’s sample corpus).
this screenshot shows Shakespeare’s works (Voyant’s sample corpus).![]()

Right now I have the word “king” selected, allowing me to see specific information about the word such as where in the corpus the word appears, frequencies of the word over time, and the word in context.
To apply Voyant specifically to runaway slave ads, Daniel and I looked at transcribed documents of runaway slave ads from Mississippi and Arkansas (PDF’s available from Documenting Runaway Slaves Project). I looked at the Arkansas ads, splitting the corpus up in two different ways. First, I split the document up by decade and then a single document of the ads from 1820-1865. (note: to turn off common stop words such as “and” “the”, click the gear icon and choose English for list of stop words) Splitting the ads up by decade could potentially make it easier to track changes over time, although since the original document was already ordered chronologically this is also possible to do with the single document. Another possibility we talked about in class is splitting up runaway ads into individual documents, making it possible to compare specific ads, rather than time clumps.
During class, Daniel and I combined the Arkansas and Mississippi documents to do a side-by-side comparison of the two states. Not surprisingly, “Arkansas” is a distinctive word in the Arkansas documents, but with other words such as “sheriff” or “committed” it could be interesting to dig down deeper and figure out why those differences exist. Are these merely linguistic/word choice differences, or do they indicate a difference in runaway patterns? These are the sorts of questions which Voyant raises, but can also help answer, with tools such as keywords in context.
I was interested in comparing the work we’d already done on Mississippi and Arkansas to some of the Texas ads we’ve collected in the Telegraph and Texas Register. I transcribed Texas ads from 1837 (excluding reprints) and compared that with Mississippi and Arkansas ads from 1837. The sample from Texas is small, so I would be hesitant to draw grand conclusions from this comparison, but it’s a good place to start addressing the questions many of us were interested in about what difference Texas makes (if any) in runaway patterns. Here are the results of all three states for 1837. Looking forward, I’m interested in looking at these results more closely to see if they raise interesting questions regarding Texas. This can help us answer questions about whether or not it’s worthwhile to continue transcribing Texas ads (and if so, how many), and how to split up the data (by year, by individual advertisement?).
The main downside to using Voyant so far is the same issue we ran into with Mallett: the Telegraph and Texas Register advertisements are not available individually in text format. This is not so much a limitation with Voyant itself as it is with the medium of primary source documents we are working with. It does seem at this point that Voyant could be a useful tool, but if we as a class decide to use Voyant for our project in the future, we’ll have to think of ways to get around that obstacle.
