Since our last progress report, we have completed the following tasks:
- Clare revised the rough draft for the close reading essay. You can view the new draft at the bottom of the post.
- Aaron revised locations_tag.py to merge location entities that are in close proximity in the ad. For example, the raw results of NER for “Sheriff of Pulaski County, Arkansas” are “Pulaski County” and “Arkansas”. The script would convert those terms into a single expression, “Pulaski County, Arkansas”. This makes it easier to generate geo-coordinates for the referenced locations and to trim down the amount of location results. Additionally, we were having problems with incomplete results due to the word “County” being spelled in lowercase and abbreviated. The new version of the script pre-processes the text files to find/replace words such as these.
- Aaron wrote a script count_states.py to convert the output from locations_tag.py into a mapping between each ad and the states referenced in that ad. It will be used to tally the number of references to each other state in our Texas, Mississippi, and Arkansas datasets.
- Kaitlyn has been working on example maps using Google Fusion Tables. To generate state counts, she used the Find feature of her text editor to count number of occurrences of known state names (but not initials). Once we have more accurate numbers when count_states.py is extended in functionality, we will be able to create a more accurate map.
- Kaitlyn also test-drove Palladio. The following is her comments on it:
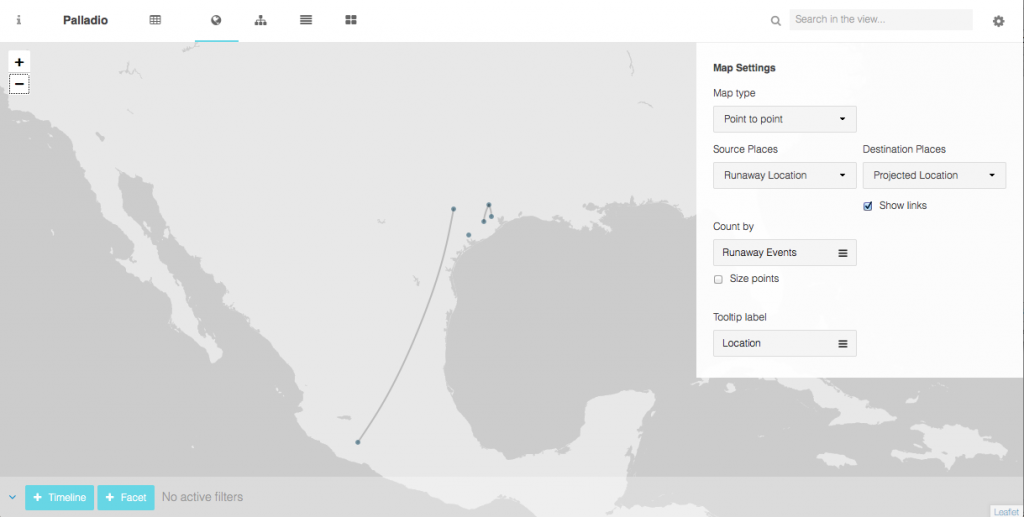
I was able to take a look at what Palladio has to offer for us, and I think it could be a really interesting tool because of the “point to point” mapping abilities. I quickly learned how to upload spreadsheets to Palladio and extend spreadsheets to certain variables. For example, I created a spreadsheet with columns “Year Ad Published,” “Slave Name,” “Owner Name,” “Owner Location,” “Runaway Location,” “Projected Location,” and “Permalink” and was able to link all of the location variables to a spreadsheet that contained coordinates for each place. Then, using the Palladio mapping tool, I was able to create a map that connected the Runaway Locations to the Projected Locations for each advertisement. Although I only have a few points right now, one can see how this tool could be useful for looking at how connected different places are to each other. If we want to use Palladio, we will need to start expanding the spreadsheet, which is time consuming because it requires manually inputting data. I think Palladio could be a useful tool for showing some of the outliers in our advertisement corpora.
Her comments on creating the fusion tables:
Using basic search functions, I have been taking the data that Aaron collected by running the ads through his tagging script and counting how many times state names are mentioned in each of the state corpora (I have been searching only for whole names right now; eg: “Texas” and not “TX” or “TEX”). This enables me to get a sense of what the google fusion table maps will look like with real data. The main issue that I have come across in doing this is coming up with a scale that will work across the Texas, Arkansas, and Mississippi ads. Because Arkansas and Mississippi have so many more ads than Texas, there is no way right now to line up the scales. Depending on what our final data looks like, it might be a good idea to use percentages instead of raw data. That way, the scale can be consistent as you hover over different states and see each state’s data.
Example Fusion maps:
Texas: Texas Fusion Table
Arkansas: Arkansas Fusion Table
Mississippi: Mississippi Fusion Table
Next Steps
Our next steps are to continue cleaning up our locations data. We need to finish this before we can have final numbers for number of times each state in our data set referenced other U.S. states. To make the data comparable across states and reduce the size of the data set, we will be eliminating pre-1835 ads from the results.
We will be revising our rough draft to ad more citations to back up the claims after we have hard numbers.
We will decide what tool we will use for creating our maps, whether that be Google Fusion Tables or Palladio. Both have their merits.
Rough Draft
Notes from Clare:
Over the past week, I have been going over slave advertisements from Texas and Mississippi in order to close-read and discover trends in geographical patterns or relationships. Based on the suggestions and on reading Team 1’s rough draft, I re-wrote the close-reading as a more general survey, eliminating many of the specific examples and consolidating information into about a paragraph for each state.
Please comment on the rough draft!!


