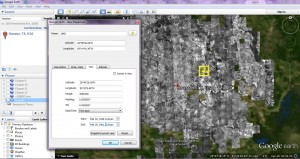
After completing the tutorials for the geographical digital tools, Kaitlyn and I decided that change across time was an essential element of a mapping tool for our project with runaway ads. Google Fusion, although interesting and relatively accessible as far as understanding, does not fulfill those needs. Our primary focus, then, has been on Google Earth. Enabling “Historical Imagery” under “View” creates a timeline with slider from 1943 to 2014 of the map imagery at a given time. Our next concern, then, was how we ourselves could insert time-specific data into Google Earth. In the “Properties” of a placemark under the “View” tab, there is an option under Date/Time for Time span and Time stamp.
We inserted two placemarks with different time spans in order to test the feature. Although the movement of the time slider seemed to acknowledge the fact that the span of years was between 1960 and 1965, the markers did not disappear when the time span was absent. Our primary problem, then, is in trouble-shooting this problem, since the feature itself seems to represent something we could use as far as time span data.
Andrew suggested a more computer-science based option through KML and the use of programming and coding in order to possibly diagnose the error. In addition, while searching for assistance with Google Earth time span, I discovered a digital humanities document from UCLA on the topic that seems like it could be of assistance. It seems to be relatively step-by-step but my limited knowledge of programming has left me confused with how to work with this possible option.
Issues with Google Earth: it tends to crash or malfunction with relative frequency, which I have learned through previous path tracking work with it. For this reason, it would be more beneficial to find a tool that specializes in mapping over time, since the many features and possibilities are not necessary for our project and probably exacerbate the issue of frequent crashes.
One question that we would need to answer about our project is whether we want to map using regions or points. Regions would indicate frequency of runaways from a given area, or likelihood/projection of the owners on where their runaways have fled. A map of this sort would provide multiple layers of information about runaways: how likely they were to run away at a given time and how high runaway rates were in certain areas (if we wanted to focus solely on the latter question, we could probably use Google Fusion as our tool.) A map with placemarks could easily become overcrowded with pinpoints. Although this problem could be solved through different color-coding techniques, any advantages of placemarks would be removed through getting rid of the specific location. Therefore, region-based mapping (around county, possibly?) seems to be the best option as far as runaway ads. Our data set would have to be examined in order to determine whether the information it provided would allow for such a system.
Today in class, we will possibly research the basic KML scripts that seem to be necessary for functioning of the Google Earth time span. With assistance, maybe we will be able to start working with the basic coding language using the steps from the UCLA document. We will also explore the timemapper option suggested by Dr. McDaniel over Twitter, in addition to neatline, a website that Kaitlyn was planning on exploring. Once we determine whether or not these options are feasible for us, we will compare the possible time mapping tools and discuss their pros and cons in relationship to our particular topic of runaway slave ads and our specific data set.

