This past week, Alyssa and I have been looking at ways to quantify similarity of documents. We are doing this in the context of comparing Texas runaway slave ads to runaway slave ads from other states. Thanks to the meticulous work of Dr. Max Grivno and Dr. Douglas Chambers in the Documenting Runaway Slaves project at the Southern Miss Department of History, we have at our disposal a sizable set of transcribed runaway slave ads from Arkansas and Mississippi that we will be able to experiment with. Since the transcriptions are not in the individual-document format needed to measure similarity, Franco will be using regex to split those corpora into their component advertisements.
The common method to measure document similarity is taking the cosine similarity of TF-IDF (term frequency–inverse document frequency) scores for words in each pair of documents. You can read more about how it works and how to implement it in this post by Jana Vembunarayanan at the blog Seeking Similarity. Essentially, term frequency values for each token (unique word) in a document are obtained by counting the occurrences of a word within that document, then those values are normalized by the inverse document frequency (IDF). The IDF is the log of the ratio of the total number of documents to the number of documents containing that word. Multiplying the term frequency by the inverse document frequency thus weights the term by how common it is in the rest of corpus. Words that occur in high frequency in a specific document but rarely in the rest of the corpus achieve high TF-IDF scores, while words that occur in lower frequency in a specific document but commonly in the rest of the corpus achieve high TF-IDF scores.
Using cosine similarity with TF-IDF seems to be the accepted way to compute pairwise document similarity, and as to not reinvent the wheel, we will probably use that method. That said, some creativity is needed to compare corpora as a wheel, rather than just two documents. For example, which corpora are most similar: Texas’s and Arkansas’s, Arkansas’s and Mississippi’s, or Texas’s and Mississippi’s? We could compute an average similarity of all pairs of documents in each pair of corpora.
Just as a side-note, if we solve the problem of automatically transcribing individual Texas runaway ads, we could use cosine similarity and TF-IDF to locate duplicate ads. Runaway slave ads were often posted multiple times in a newspaper, sometimes with minor differences between each printing of the advertisement (for example, in reward amount). We could classify pairs of documents with a cosine similarity score greater than a specified threshold as duplicates.
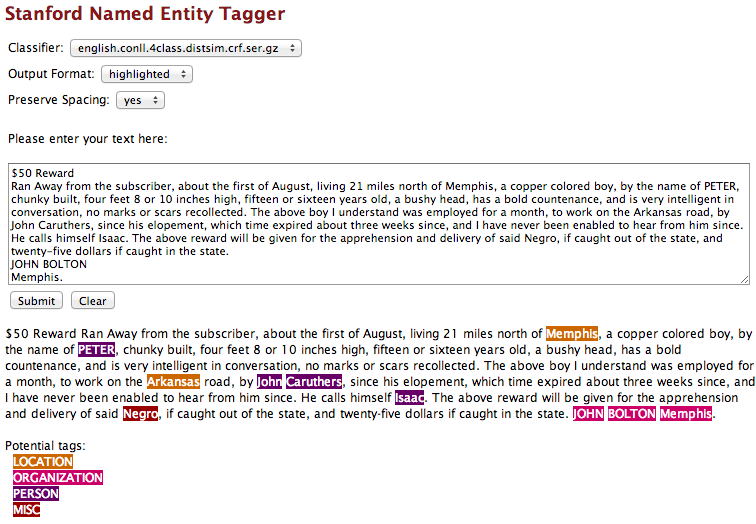
We could also use Named Entity Recognition to measure the similarity of corpora in terms of place-connectedness. Named Entity Recognition is a tool to discover and label words as places, names, companies, etc. Names might not be too helpful since, as far as I have been able to tell, slaves were usually identified just by a first name, but it would be interesting to see which corpora reference locations corresponding to another state. For example, there might be a runaway slave ad listed in the Telegraph and Texas Register in which a slave was thought to be heading northeast towards Little Rock, where he/she has family. The Arkansas corpus would undoubtedly have many ads with the term Little Rock. If there were a significant number of ads in Texas mentioning Arkansas places, or vice-versa, this is information we would want to capture to measure how connected the Texas and Arkansas corpora are.

Demo run of Stanford's Named Entity Tagger on an Arkansas runaway slave ad
A simple way we could quantify this measure of place-connectedness would start with a Named Entity Recognition list of tokens and what type of named entity they are (if any). Then we would iterate through all tokens and, if the token represents a location in another state in the corpus (perhaps the Google Maps API could be used?), increment the place-connectedness score for that pair of states.
We also explored other tools that can be used to compare text documents. In class, we have already looked at Voyant Tools, and now have been looking at other types of publicly available tools that can be used to compare documents side by side. TAPoR, is a useful resource that lets you browse and discover a huge collection of text analysis tools from around the web. It contains tools for comparing documents as well as for other kinds of text analysis. As we move forward with our project, TAPoR could definitely be a great resource for finding and experimenting with different tools that can be applied to our collection of runaway slave ads.
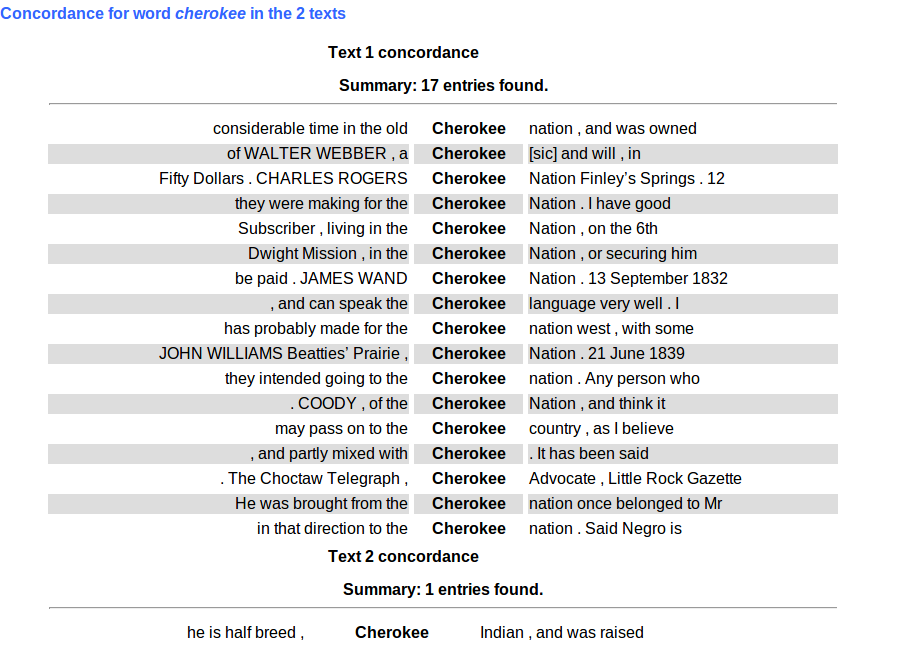
TAPoR provides a tool from TAPoRware called Comparator that analyzes two documents side by side to compare word counts and word ratios. We tested this tool on the Arkansas and Mississippi runaway advertisement collections. This sample comparison already yields interesting results, and gives an idea of how we could use word ratios to raise questions about runaway slave patterns across states.


These screenshots show a test run of the ads through the TAPoR comparator; the Arkansas ads are Text 1 and the Mississippi ads are Text 2. This comparison reveals that the words “Cherokee” and “Indians” have a high relative frequency for the Arkansas corpus, perhaps suggesting a higher rate of interaction between runaway slaves and Native Americans in Arkansas than in Mississippi. Click on a word of interest to get a snippet of the word in context. Upon looking into the full text of ads containing the word “Cherokee”, we find descriptions of slaves running away to live in the Cherokee nation, or running away in the company of Native Americans, slaves that were part Cherokee and could speak the language, or even one of a slave formerly being owned by a Cherokee.
However, after digging into the word ratios a little deeper, it turns out that uses of the word “Choctaw” and “Indian” are about even for Arkansas and Mississippi, so the states in the end may have similar patterns of runaway interaction with Native Americans. Nevertheless, this test of the Comparator gives us an idea of the sorts of questions it could help raise and answer when comparing advertisements. For example, many of us were curious if Texas runaway slaves ran away to Mexico or ran away with Mexicans. We could use this tool to look at ratios of the words “Mexico” or “Mexican” in Texas in comparison to other states.


