Category Archives: Uncategorized

Historiographical Essay Rough Draft 2

Not much research has been done on slavery in Texas. John Hope Franklin and Loren Schweninger’s Runaway Slaves: Rebels on the Plantation, one of the most comprehensive projects on runaway slaves in the South, does not even include Texas in the data or analysis, but rather implies that slavery seems to be relatively universal throughout the South. Randolph B. Campbell opened the discussion of slavery in Texas through his book An Empire for Slavery: The Peculiar Institution in Texas, 1821-1865, but agreed with Franklin and Schweninger on the similarities across the country. William Dean Carrigan, however, took another position in the chapter on Texas in his book Slavery and Abolition: he argued that slavery in Texas (specifically in central Texas) was unique from that in other Southern states. However, the lack of information on the topic indicates the need for additional research in order to reach a more definitive conclusion.

Why would Texas be different from other states? Since Texas was the frontier of plantation agriculture, many diverse groups interacted with the slaveholders and their slaves. Mexicans (to the south) and Indians (to the north and west) increased owner fears and possibly runaway occurrences as well. The proximity of Mexico and the absence of a fugitive slave law there made it a more desirable runaway location than the North, which was still impacted by fugitive slave laws. The presence of Indian tribes just on the outskirts of the plantation culture provided another possible refuge for runaways. Although not all Indians were friendly to runaway slaves and although the proximity of Mexico did not necessarily result in increased runaway occurrences, both of these factors could have contributed to the culture of slavery in Texas. In addition the lower population density and wooded terrain of central Texas were possible advantages for runaways.

These factors not only framed the diversity of options available to runaways but also impacted slaveholders’ perceptions of their slaves. How did slaveholders react to the many runaway possibilities? Did they treat or perceive their slaves differently? Or were Texas slaveholders essentially the same as slaveholders in any other state? Runaway slave advertisements allow a glimpse into these perspectives through the language they use to describe the slaves. These advertisements were prevalent throughout the South prior to the Civil War, and are thus an important historical resource for historians. Our project will compare Texas advertisements (from the Houston Telegraph) with those from other states in order to contribute toward a more comprehensive view on slavery in Texas.

In order to accomplish this, we will utilize various digital tools. The term “digital history” addresses two different perspectives: using digital tools to discover new information and using the digital to present those findings. By exploring different methodologies, we may be able to benefit historians as a whole by contributing to future ways of working with data. In addition, we are interested in the digital presentation of history: what are the various benefits and disadvantages of each method? The basic essay format is only one of many ways of presenting information, and other genres provide unique perspectives on the same argument. These explorations will contribute to both the historical and the methodological in the context of Texas runaway slaves and the digital humanities, allowing our research to stretch beyond the specific into future possibilities of genre and method.
Wednesday Recap

Today in class we stepped back for a moment to think about the various methods we could use to compare runaway ads from different states. Our current, still subject to change job is to build a site that would compare different methods for answering the question: "Were Texas runaway slave ads different from slave ads in other Southern states?"

Continue reading

Historiographical Essay Rough Draft

Please comment!

Not much research has been done on slavery in Texas. John Hope Franklin and Loren Schweninger’s Runaway Slaves: Rebels on the Plantation, one of the most comprehensive projects on runaway slaves in the South, does not even include Texas in the data or analysis, but rather implies that slavery seems to be relatively universal throughout the South. Randolph B. Campbell opened the discussion of slavery in Texas through his book An Empire for Slavery: The Peculiar Institution in Texas, 1821-1865, but agreed with Franklin and Schweninger on the similarities across the country. William Dean Carrigan, however, took another position in the chapter on Texas in his book Slavery and Abolition: he argued that slavery in Texas (specifically in central Texas) was unique from that in other Southern states. However, the lack of information on the topic indicates the need for additional research in order to reach a more definitive conclusion.

Why would Texas be different from other states? Since Texas was the frontier of plantation agriculture, many diverse groups interacted with the slaveholders and their slaves. Mexicans (to the south) and Indians (to the north and west) increased owner fears and possibly runaway occurrences as well. The proximity of Mexico and the absence of a fugitive slave law there made it a more desirable runaway location than the North, which was still impacted by fugitive slave laws. The presence of Indian tribes just on the outskirts of the plantation culture provided another possible refuge for runaways. Although not all Indians were friendly to runaway slaves and although the proximity of Mexico did not necessarily result in increased runaway occurrences, both of these factors could have contributed to the culture of slavery in Texas. In addition the lower population density and wooded terrain of central Texas were possible advantages for runaways.

These factors not only framed the diversity of options available to runaways but also impacted slaveholders’ perceptions of their slaves. How did slaveholders react to the many runaway possibilities? Did they treat or perceive their slaves differently? Or were Texas slaveholders essentially the same as slaveholders in any other state? Runaway slave advertisements allow a glimpse into these perspectives through the language they use to describe the slaves. Through the utilization of various digital tools and comparison of the Texas advertisements (from the Houston Telegraph) with those of other states, we hope to contribute an additional facet to the debate on slavery in Texas.


Measuring Document Similarity and Comparing Corpora

This past week, Alyssa and I have been looking at ways to quantify similarity of documents. We are doing this in the context of comparing Texas runaway slave ads to runaway slave ads from other states. Thanks to the meticulous work of Dr. Max Grivno and Dr. Douglas Chambers in the Documenting Runaway Slaves project at the Southern Miss Department of History, we have at our disposal a sizable set of transcribed runaway slave ads from Arkansas and Mississippi that we will be able to experiment with. Since the transcriptions are not in the individual-document format needed to measure similarity, Franco will be using regex to split those corpora into their component advertisements.

The common method to measure document similarity is taking the cosine similarity of TF-IDF (term frequency–inverse document frequency) scores for words in each pair of documents. You can read more about how it works and how to implement it in this post by Jana Vembunarayanan at the blog Seeking Similarity. Essentially, term frequency values for each token (unique word) in a document are obtained by counting the occurrences of a word within that document, then those values are normalized by the inverse document frequency (IDF). The IDF is the log of the ratio of the total number of documents to the number of documents containing that word. Multiplying the term frequency by the inverse document frequency thus weights the term by how common it is in the rest of corpus. Words that occur in high frequency in a specific document but rarely in the rest of the corpus achieve high TF-IDF scores, while words that occur in lower frequency in a specific document but commonly in the rest of the corpus achieve high TF-IDF scores.

Using cosine similarity with TF-IDF seems to be the accepted way to compute pairwise document similarity, and as to not reinvent the wheel, we will probably use that method. That said, some creativity is needed to compare corpora as a wheel, rather than just two documents. For example, which corpora are most similar: Texas’s and Arkansas’s, Arkansas’s and Mississippi’s, or Texas’s and Mississippi’s? We could compute an average similarity of all pairs of documents in each pair of corpora.

Just as a side-note, if we solve the problem of automatically transcribing individual Texas runaway ads, we could use cosine similarity and TF-IDF to locate duplicate ads. Runaway slave ads were often posted multiple times in a newspaper, sometimes with minor differences between each printing of the advertisement (for example, in reward amount). We could classify pairs of documents with a cosine similarity score greater than a specified threshold as duplicates.

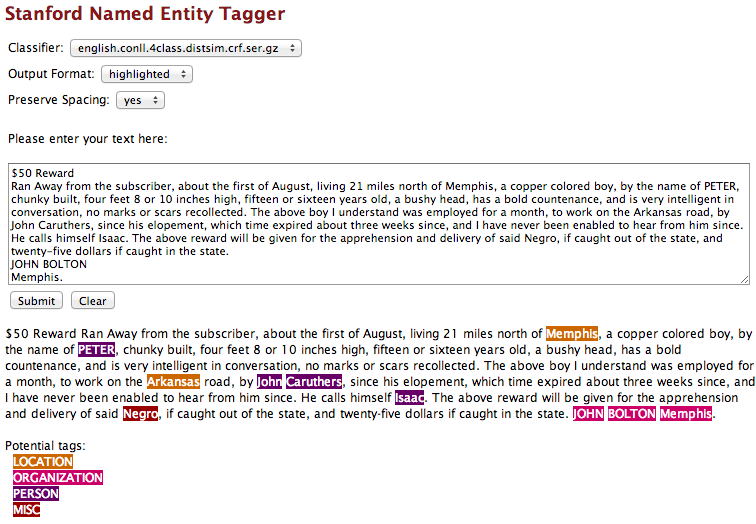
We could also use Named Entity Recognition to measure the similarity of corpora in terms of place-connectedness. Named Entity Recognition is a tool to discover and label words as places, names, companies, etc. Names might not be too helpful since, as far as I have been able to tell, slaves were usually identified just by a first name, but it would be interesting to see which corpora reference locations corresponding to another state. For example, there might be a runaway slave ad listed in the Telegraph and Texas Register in which a slave was thought to be heading northeast towards Little Rock, where he/she has family. The Arkansas corpus would undoubtedly have many ads with the term Little Rock. If there were a significant number of ads in Texas mentioning Arkansas places, or vice-versa, this is information we would want to capture to measure how connected the Texas and Arkansas corpora are.

Demo run of Stanford's Named Entity Tagger on an Arkansas runaway slave ad

A simple way we could quantify this measure of place-connectedness would start with a Named Entity Recognition list of tokens and what type of named entity they are (if any). Then we would iterate through all tokens and, if the token represents a location in another state in the corpus (perhaps the Google Maps API could be used?), increment the place-connectedness score for that pair of states.

We also explored other tools that can be used to compare text documents. In class, we have already looked at Voyant Tools, and now have been looking at other types of publicly available tools that can be used to compare documents side by side. TAPoR, is a useful resource that lets you browse and discover a huge collection of text analysis tools from around the web. It contains tools for comparing documents as well as for other kinds of text analysis. As we move forward with our project, TAPoR could definitely be a great resource for finding and experimenting with different tools that can be applied to our collection of runaway slave ads.

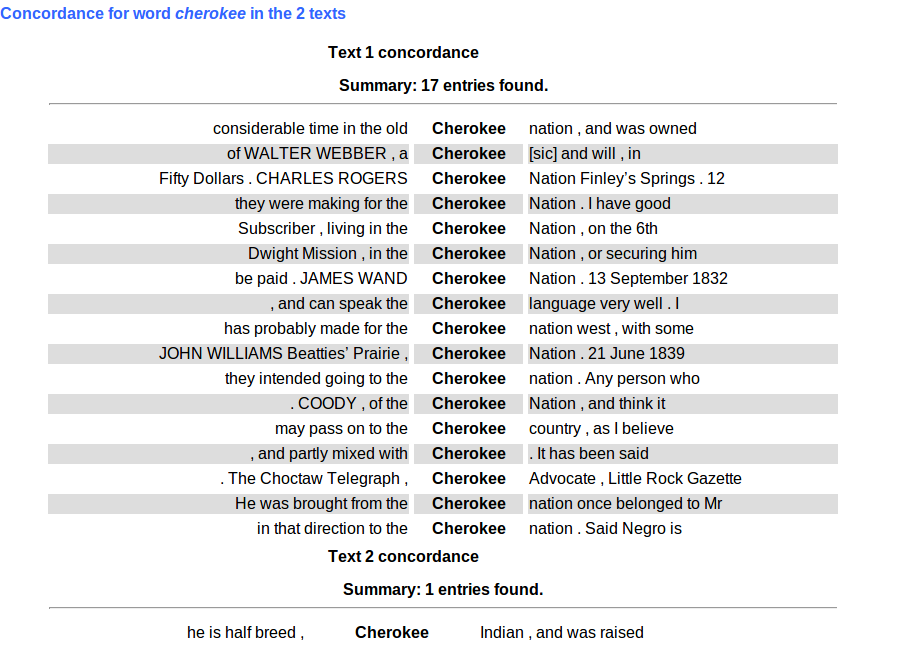
TAPoR provides a tool from TAPoRware called Comparator that analyzes two documents side by side to compare word counts and word ratios. We tested this tool on the Arkansas and Mississippi runaway advertisement collections. This sample comparison already yields interesting results, and gives an idea of how we could use word ratios to raise questions about runaway slave patterns across states.

These screenshots show a test run of the ads through the TAPoR comparator; the Arkansas ads are Text 1 and the Mississippi ads are Text 2. This comparison reveals that the words “Cherokee” and “Indians” have a high relative frequency for the Arkansas corpus, perhaps suggesting a higher rate of interaction between runaway slaves and Native Americans in Arkansas than in Mississippi. Click on a word of interest to get a snippet of the word in context. Upon looking into the full text of ads containing the word “Cherokee”, we find descriptions of slaves running away to live in the Cherokee nation, or running away in the company of Native Americans, slaves that were part Cherokee and could speak the language, or even one of a slave formerly being owned by a Cherokee.

However, after digging into the word ratios a little deeper, it turns out that uses of the word “Choctaw” and “Indian” are about even for Arkansas and Mississippi, so the states in the end may have similar patterns of runaway interaction with Native Americans. Nevertheless, this test of the Comparator gives us an idea of the sorts of questions it could help raise and answer when comparing advertisements. For example, many of us were curious if Texas runaway slaves ran away to Mexico or ran away with Mexicans. We could use this tool to look at ratios of the words “Mexico” or “Mexican” in Texas in comparison to other states.

Collecting information about Mississippi and Arkansas Advertisements

Daniel and I have been working on looking more closely at the advertisements from Arkansas and Mississippi digitized in the Documenting Runaway Slaves project. Using regular expressions, we are cleaning up the text files in Text Wrangler to remove unwanted information, such as footnotes, extra dates, and page numbers. Our goal is to find out how many total ads there are for each state, how many ads there are in each particular newspaper, and how many ads there are between the years 1835-1860. Below is our progress divided by state.

Arkansas Advertisements – Daniel

By using regular expressions to search for individual dates for ads and separate them into individual text files, we were able to identify 457 separate ads for Arkansas.  Within this subdivision, searching the years of the groups narrowed down the pool of ads to 324 within the range of 1835-1860.

Uploading the text to Voyant Tools, I was able to use the ResoViz tool to identify the different organizations in the ads.  This gave a strong pointer towards which newspaper titles occur most frequently within the base of ads.  Searching for these in the text in Text Wrangler, I was then able to count how many occurrences there were with the “Find All” feature.  This search found 272 occurrences of the Arkansas Gazette.  28 of these were overcounted due to mentions in footnotes (which we were unable to remove from the PDF).  Removing these left an adjusted count of 244 runaway ads in the Arkansas Gazette from 1835-1860.  A similar search revealed the runner-up publications of ads to be 35 ads by the Washington Telegraph during this time, and 31 by the Arkansas Advocate.

Mississippi Advertisements – Kaitlyn

First, I removed the extra date headers by using the regular expression #1, posted as a gist on my github account. Then, I removed the page numbers by using regular expression #2. That’s when I started seeing some issues in how the text copied over from the PDF file I downloaded from the Documenting Runaway Slaves advertisement. As shown in the picture below, I discovered that every time a superscript (such as th, st, or nd) is used, the text does not copy over in the correct order.

As you can see on line 342, the text abruptly cuts off right where the th superscript should be, and the rest of the text that follows is now placed on line 351. The superscript has been placed on line 341 (or line 347 — both contain “th”). The superscripts for numbers were not used consistently throughout the document, so it is not a consistent problem for all of the advertisements. It also poses more of a problem when we start using the advertisements for analysis.

One other problem I discovered is that some of the dates in the [date Month year] format is that some of the lines end in a period, some do not have a period, and some have bracketed edited information. Therefore, I had to use regular expression #3 to figure out how many advertisements the document contained. I found 1633 matches, which was about four times as many as we found from Arkansas. I additionally used regular expression #4 to figure out how many advertisements we had from the period of 1835-1860, and I discovered 1060 matches. There possibly could have been a more effective way to do this, but I think I was able to find them all using that expression.

I am still working on figuring out how to remove all of the footnotes. The footnotes do not seem to have any similarities between them except for a number at the beginning of a line, so it is difficult to remove them without removing advertisement information as well. Additionally, I will use ResoViz to see how many advertisements we have from each newspaper as Daniel did with the Arkansas ads, but because there are too many ads collected from Mississippi to analyze them all at the same time using Voyant, this task is taking longer than I originally thought it would.

Progress Report for Introductory Historiographical Essay

My project involves writing an introductory explication detailing the background of runaway slave research in Texas. After I finished re-reading the chapters by Campbell and Carrigan, I outlined a basic structure for the essay, included below:

  1. An introductory paragraph, including a hook to grab interest (comparison of descriptions of October 1835 slave rebellion by Campbell and Carrigan) and information about the work that has been completed on Texas up to this point
  2. Present a general overview of the argument that Texas is the same as other Southern states, then transition to a more specific focus on the spectrum of reactions to slavery (submission, rebellion, and somewhere in between).
  3. Categorization of various types of runaways (long term, toward family, to woods, habitual)
  4. Present a general overview of the argument that Texas is unique, addressing the issue of how it would differ (in its process or in the overall result). Introduce the central concept of Texas as a frontier on multiple levels (western frontier of plantation agriculture, surrounded by multiple cultures).
  5. Address the impact of the proximity of Mexico on slavery in Texas, discussing Mexico’s fugitive slave policy in contrast to that of the North, the increase of fears in slave holders, the slightly higher number of runaways (both from Texas and outside of Texas), and the impact of the prevalence versus the climate of slaves and slave holders
  6. Discuss Indian interaction with slaves, specifically the blessing and curse aspect of their relationship
  7. Touch briefly on the slave rebellions
  8. Specify that many of the arguments made were from the perspective of central Texas, and include information about the terrain, low population, and greater freedom of resource
  9. Carrigan’s conclusion of the process as different but not the outcome. Differences become more similar with increased military control and increase in white population. Overall, climate was different because slaves had increased opportunities for running away, and thus had more leverage with their owners.
  10. Possible causes and differences discussed in class, such as Texas before and after its entrance into the Union
  11. Conclusion: more research is necessary on runaways in Texas

The structure may change slightly after writing it. Currently, I do not envision using many specific examples and will probably focus on generalizations. I plan on completing a rough draft of the background information by Wednesday, but in the meantime, I would appreciate any comments or suggestions on my current outline!

Parsing Newspaper Images

We are trying to parse newspaper images into discrete, smaller image components containing separate articles – which (unsurprisingly) is proving more difficult than we imagined. We are trying to use OpenCV to separate different articles from each other by identifying lines in the newspaper and using those lines to separate articles, but the line detection Hough Transformation program works very poorly on the input articles. We are now switching to finding the runaway slave icon in the text, which we are doing through image recognition software (HAR image detection) in OpenCV. We have not given up parsing documents by articles, though – which we are now considering parsing by image variation – detecting text from whitespace through pixel values, and then mapping text lines to find changes in text style corresponding to the end of one article and the beginning of another.

– Franco Bettati, Aaron Braunstein

Homework #5: Working with Google Maps, Google Earth, and “Time Map” Tools

Over the weekend, I completed the “Intro to Google Maps and Google Earth” tutorial from The Programming Historian. I learned how to import a dataset into a layer on Google Maps. The tutorial used data about UK Global Fat Supply from 1896, and through changing the style of the placemarks, I created a map that colors the placemarks by what kind of commodity that region provided.

Additionally, I learned how to create my own placemarks, lines, and polygons (enclosed areas or regions) on Google Maps. Knowing how to create these vector layers could be important for our project because many of our historical questions deal with geography, such as the difference between the slaveholders’ “geography of confinement” versus the slaves’ “rival geography” (for a full list of questions, see our previous post about historical questions).  However, it is more likely that we will be creating spreadsheets with the data that we will eventually want to use in a map, such as the location of the slave owner or the possible location the slave ran. Overall, Google Maps seems like a pretty simple tool for plotting locations or events. One of the main drawbacks of Google Maps, however, is that it can only import the first 100 rows of a dataset and only 3 datasets for a total of 300 features. It seems like we possibly have more data without narrowing the advertisements down than Google Maps can hold.

The tutorial also let me explore some of the features of Google Earth. Google Earth has the ability to create vector layers like in Google Maps, but it also has more advanced features such as the ability to upload a historical map to overlay over a section of Google Earth.

Map of Canada from 1815 overlayed on Google Earth

Google Earth has an interesting historical imagery view, which includes a sliding timeline bar that shows what a region looked like at a particular moment in time. Clare and I thought that we would be able to add placemarks with certain time stamps so that they only showed up at a certain point in time and then to animate the whole sequence. We tried valiantly to make it work, but the placemarks appeared regardless of which point in the timeline was selected on the timeline bar. At this point, without finding some sort of tutorial, I do not think we can go much further with animating placemarks on Google Earth.

We do think that being able to animate points in time would be useful for us to look at many of our historical questions. Neatline, a tool of the online exhibit creator Omeka, would give us the ability to do this. On Wednesday, I would like to take a closer look at what Neatline and TimeMapper (another tool for making “time maps”) do to see if either is something that we might want to pursue. In addition to looking at these time mapping tools during class, I want to look back over the tutorial on thematic data maps to better understand how Google Fusion Tables works. I think that these tools dealing with geography will potentially be useful in analyzing or presenting our data because of the focus on geography that many of our historical questions have.

Using Voyant Tools for Runaway Ads

I’ve been using the site Voyant Tools to look at the text content of runaway ads.
In a nutshell, the site pulls all the words, and finds their frequencies and trends.  It displays them in a variety of ways, which I’ll show with its analysis of 550 pages of Mississippi slave ads.

Without screenshots, you can view the results through this link (one feature is the enabled url and unique ID for data sets, which allows re-linking and comparing between documents).

Features include Cirrus- a basic word cloud, numerical data for the appearances of words in the corpus, the option to see each appearance in context, and Trends- a tool that visually maps out the relative frequency of the word throughout the course of the document.

This last tool is the most interesting to me, as in chronologically ordered ad sets, it gives you an immediate look at the relative usage of the term over time.  For example, the use of 1836 has one remarkable spike in usage over the course of several decades… We can use this to track usage of racial descriptive terms over time, or similar word-based information.

Through the incorporation of numerous corpuses of information, we can also compare word usage in different states and areas.  I can see how this will be helpful in the future in answering some of our questions regarding how Texas runaways and situations were different from those in the rest of the south.

Digital Mapping with Time Features

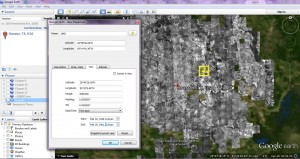
After completing the tutorials for the geographical digital tools, Kaitlyn and I decided that change across time was an essential element of a mapping tool for our project with runaway ads. Google Fusion, although interesting and relatively accessible as far as understanding, does not fulfill those needs. Our primary focus, then, has been on Google Earth. Enabling “Historical Imagery” under “View” creates a timeline with slider from 1943 to 2014 of the map imagery at a given time. Our next concern, then, was how we ourselves could insert time-specific data into Google Earth. In the “Properties” of a placemark under the “View” tab, there is an option under Date/Time for Time span and Time stamp.

We inserted two placemarks with different time spans in order to test the feature. Although the movement of the time slider seemed to acknowledge the fact that the span of years was between 1960 and 1965, the markers did not disappear when the time span was absent. Our primary problem, then, is in trouble-shooting this problem, since the feature itself seems to represent something we could use as far as time span data.

Andrew suggested a more computer-science based option through KML and the use of programming and coding in order to possibly diagnose the error. In addition, while searching for assistance with Google Earth time span, I discovered a digital humanities document from UCLA on the topic that seems like it could be of assistance. It seems to be relatively step-by-step but  my limited knowledge of programming has left me confused with how to work with this possible option.

Issues with Google Earth: it tends to crash or malfunction with relative frequency, which I have learned through previous path tracking work with it. For this reason, it would be more beneficial to find a tool that specializes in mapping over time, since the many features and possibilities are not necessary for our project and probably exacerbate the issue of frequent crashes.

One question that we would need to answer about our project is whether we want to map using regions or points. Regions would indicate frequency of runaways from a given area, or likelihood/projection of the owners on where their runaways have fled. A map of this sort would provide multiple layers of information about runaways: how likely they were to run away at a given time and how high runaway rates were in certain areas (if we wanted to focus solely on the latter question, we could probably use Google Fusion as our tool.)  A map with placemarks could easily become overcrowded with pinpoints. Although this problem could be solved through different color-coding techniques, any advantages of placemarks would be removed through getting rid of the specific location. Therefore, region-based mapping (around county, possibly?) seems to be the best option as far as runaway ads. Our data set would have to be examined in order to determine whether the information it provided would allow for such a system.

Today in class, we will possibly research the basic KML scripts that seem to be necessary for functioning of the Google Earth time span. With assistance, maybe we will be able to start working with the basic coding language using the steps from the UCLA document. We will also explore the timemapper option suggested by Dr. McDaniel over Twitter, in addition to neatline, a website that Kaitlyn was planning on exploring.  Once we determine whether or not these options are feasible for us, we will compare the possible time mapping tools and discuss their pros and cons in relationship to our particular topic of runaway slave ads and our specific data set.