Category Archives: Text Mining

Getting Ads from PDFs

You may have noticed that I was able to put a pretty clean ZIP file of Arkansas ads into our private repository. As you know, we’ve had some difficulties copying and pasting text from the wonderful PDFs posted by the Documenting Runaway Slaves project: namely, copying and pasting from the PDF into a text file results in footnotes and page numbers being mixed in with the text. Funny things also happen when there are superscript characters. This makes it difficult for us to do the kinds of text mining and Named Entity Recognition that we’re most interested in. But in this post I’ll quickly share how I dealt with these difficulties.

The key first step was provided by this tutorial on using the Automator program bundled with most Mac computers to extract Rich Text from PDFs. The workflow I created looked like this:

Screen shot of Automator workflow

Screen shot of Automator workflow

Extracting the text as "Rich Text" was the key. Running this workflow put an RTF file on my desktop that I then opened in Microsoft Word, which (I must now grudgingly admit) has some very useful features for a job like this. When I opened the file, for example, I noticed that all of the footnote text was a certain font size. I then used Word’s find and replace formatted text function to find and eliminate all text of that font size.

I used a similar technique to get rid of all the footnote reference numbers in the text, but in this case I had to be more specific because some of the text I wanted to preserve (like superscript "th," "st, and "nd" for ordinal numbers like "4th," "1st," and "2nd") was the same font size as the footnote markers. So I used Word’s native version of regular expressions (called wildcards) to find only numbers of that font size. In other words, the "Advanced Find and Replace" dialogue I used looked like this:

Word find and replace dialogue with wildcards

Word find and replace dialogue with wildcards

I used the same technique to eliminate the reference numbers leftover from the eliminated footnotes, which were all of an even smaller font size. Similar adjustments can be made by noticing that many of the ordinal suffixes mentioned earlier ("th," "st," and "nd") are "raised" or "lowered" by a certain number of points. You can see this by selecting those abbreviations and then opening the Font window in Word. Clicking on the "Advanced" tab will reveal whether the text has been lowered or raised. An advanced find and replace to change all text raised or lowered by specific points with text that is not raised or lowered fixed some, though not all, of these problems.

At this point I reached the limit of what I could do with the formatting find and replace features in Word, so I saved my document as a Plain Text file (with the UTF-8 encoding option checked to make things easier later on our Python parsing script), and then opened it up in a text editor. At this point I noticed that there were still some problems (though not as many!) in the text:

Houston, we have a problem

Houston, we have a problem

The main problem seems to arise in cases where there was a superscript ordinal suffix in the first line of an ad. As you can see, the "th" ends up getting booted up to the first line, and the remainder of the line gets booted down to the bottom of the page. Fortunately, there seems to be some pattern to this madness, a pattern susceptible to regular expressions. I also noticed that the orphaned line fragments following ordinals seem to always be moved to the bottom of the "page" right before the page number (in this case "16"). This made it possible to do a regex search for any lines ending in "th" (or "st" or "nd") followed by another line ending in a number, followed by a replacement that moves the suffix to where it should be. Though it took a while to manually confirm each of these replacements (I was worried about inadvertently destroying text), it wasn’t too hard to do.

A second regex search for page numbers allowed me to find all of the orphan fragments and manually move them to the lines where they should be (checking the master file from DRS in cases where it wasn’t clear which ad each fragment went with). The final step (which we already learned how to do in class) was to use a regular expression to remove all the year headers and page numbers from the file, as well as any blank lines. Franco’s drsparser script did the rest of the work of bursting the text file into individual ads and named the files using the provided metadata.

Measuring Document Similarity and Comparing Corpora

This past week, Alyssa and I have been looking at ways to quantify similarity of documents. We are doing this in the context of comparing Texas runaway slave ads to runaway slave ads from other states. Thanks to the meticulous work of Dr. Max Grivno and Dr. Douglas Chambers in the Documenting Runaway Slaves project at the Southern Miss Department of History, we have at our disposal a sizable set of transcribed runaway slave ads from Arkansas and Mississippi that we will be able to experiment with. Since the transcriptions are not in the individual-document format needed to measure similarity, Franco will be using regex to split those corpora into their component advertisements.

The common method to measure document similarity is taking the cosine similarity of TF-IDF (term frequency–inverse document frequency) scores for words in each pair of documents. You can read more about how it works and how to implement it in this post by Jana Vembunarayanan at the blog Seeking Similarity. Essentially, term frequency values for each token (unique word) in a document are obtained by counting the occurrences of a word within that document, then those values are normalized by the inverse document frequency (IDF). The IDF is the log of the ratio of the total number of documents to the number of documents containing that word. Multiplying the term frequency by the inverse document frequency thus weights the term by how common it is in the rest of corpus. Words that occur in high frequency in a specific document but rarely in the rest of the corpus achieve high TF-IDF scores, while words that occur in lower frequency in a specific document but commonly in the rest of the corpus achieve high TF-IDF scores.

Using cosine similarity with TF-IDF seems to be the accepted way to compute pairwise document similarity, and as to not reinvent the wheel, we will probably use that method. That said, some creativity is needed to compare corpora as a wheel, rather than just two documents. For example, which corpora are most similar: Texas’s and Arkansas’s, Arkansas’s and Mississippi’s, or Texas’s and Mississippi’s? We could compute an average similarity of all pairs of documents in each pair of corpora.

Just as a side-note, if we solve the problem of automatically transcribing individual Texas runaway ads, we could use cosine similarity and TF-IDF to locate duplicate ads. Runaway slave ads were often posted multiple times in a newspaper, sometimes with minor differences between each printing of the advertisement (for example, in reward amount). We could classify pairs of documents with a cosine similarity score greater than a specified threshold as duplicates.

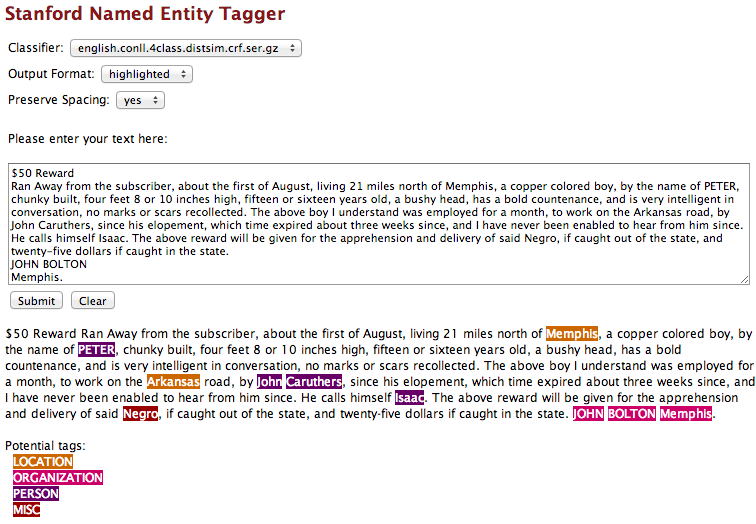
We could also use Named Entity Recognition to measure the similarity of corpora in terms of place-connectedness. Named Entity Recognition is a tool to discover and label words as places, names, companies, etc. Names might not be too helpful since, as far as I have been able to tell, slaves were usually identified just by a first name, but it would be interesting to see which corpora reference locations corresponding to another state. For example, there might be a runaway slave ad listed in the Telegraph and Texas Register in which a slave was thought to be heading northeast towards Little Rock, where he/she has family. The Arkansas corpus would undoubtedly have many ads with the term Little Rock. If there were a significant number of ads in Texas mentioning Arkansas places, or vice-versa, this is information we would want to capture to measure how connected the Texas and Arkansas corpora are.

Demo run of Stanford's Named Entity Tagger on an Arkansas runaway slave ad

A simple way we could quantify this measure of place-connectedness would start with a Named Entity Recognition list of tokens and what type of named entity they are (if any). Then we would iterate through all tokens and, if the token represents a location in another state in the corpus (perhaps the Google Maps API could be used?), increment the place-connectedness score for that pair of states.

We also explored other tools that can be used to compare text documents. In class, we have already looked at Voyant Tools, and now have been looking at other types of publicly available tools that can be used to compare documents side by side. TAPoR, is a useful resource that lets you browse and discover a huge collection of text analysis tools from around the web. It contains tools for comparing documents as well as for other kinds of text analysis. As we move forward with our project, TAPoR could definitely be a great resource for finding and experimenting with different tools that can be applied to our collection of runaway slave ads.

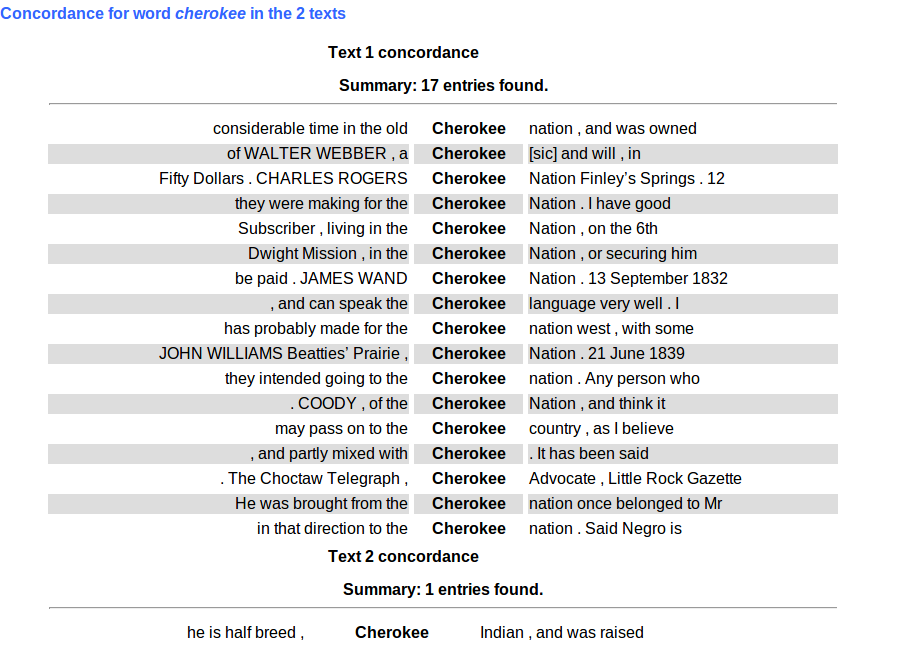
TAPoR provides a tool from TAPoRware called Comparator that analyzes two documents side by side to compare word counts and word ratios. We tested this tool on the Arkansas and Mississippi runaway advertisement collections. This sample comparison already yields interesting results, and gives an idea of how we could use word ratios to raise questions about runaway slave patterns across states.

These screenshots show a test run of the ads through the TAPoR comparator; the Arkansas ads are Text 1 and the Mississippi ads are Text 2. This comparison reveals that the words “Cherokee” and “Indians” have a high relative frequency for the Arkansas corpus, perhaps suggesting a higher rate of interaction between runaway slaves and Native Americans in Arkansas than in Mississippi. Click on a word of interest to get a snippet of the word in context. Upon looking into the full text of ads containing the word “Cherokee”, we find descriptions of slaves running away to live in the Cherokee nation, or running away in the company of Native Americans, slaves that were part Cherokee and could speak the language, or even one of a slave formerly being owned by a Cherokee.

However, after digging into the word ratios a little deeper, it turns out that uses of the word “Choctaw” and “Indian” are about even for Arkansas and Mississippi, so the states in the end may have similar patterns of runaway interaction with Native Americans. Nevertheless, this test of the Comparator gives us an idea of the sorts of questions it could help raise and answer when comparing advertisements. For example, many of us were curious if Texas runaway slaves ran away to Mexico or ran away with Mexicans. We could use this tool to look at ratios of the words “Mexico” or “Mexican” in Texas in comparison to other states.

Some Text Mining Resources

Today in class I briefly mentioned TF-IDF (Term Frequency-Inverse Document Frequency) as a possible way for us to identify "give away" words that might appear more frequently in a particular document. Here are some introductory explanations of the method:

And here’s a cool visualization experiment using TF-IDF made by Tim Sherratt, who also made the Real Face of White Australia and Headline Roulette sites shown in class today.

I also mentioned Named Entity Recognition in class; this is the same library used by the Rezo Viz tool that Daniel and Alyssa showed us in their Voyant Tools presentation. It may be possible for us simply to use Voyant as an interface for NER and export a list of place and person names from our ads, but we need to look into this further.

Slides from Tool Presentations

Thanks for the great job that you all did on your presentations about digital tools that might be helpful for our project with runaway slave ads! I’m posting here the slides that were shown in class so that we can reference them. Click the image to get the whole PDF.

First, Alyssa and Daniel talked with us about Voyant Tools:

Clare and Kaitlyn talked about using Google Maps and Google Fusion Tables, together with Social Explorer:

Thanks for sharing!

Homework #3: Using and Understanding MALLET

If you prefer, you may download this assignment in PDF form.

For our January 31 class, you read several articles about using a method called "topic modeling" to "read" texts algorithmically. In this homework assignment, you will have a chance to use MALLET, a topic modeling software package, yourself and then write a reflection on your experience that applies what you have learned to our class project.

Before You Begin

This assignment will require you to use the command line on your computer. I recommend that before you begin, you review some of the material on this that we covered in class on Friday.

If you have a Mac or Linux machine, the Command Line Bootcamp from the Scholars’ Lab at the University of Virginia is a useful place to begin, and it is aimed at humanities students and scholars. If you have a Windows machine, here is a basic introduction to the DOS prompt.

Regardless of your machine, there are three main things you will need to be able to do in this assignment from the command line, so make sure you understand how to do each of them:

  • See what directory you are currently in.
  • Change directories.
  • List the contents of the current directory.
  • See inside the contents of a file.

You may also want to know how to clear your terminal screen if it becomes too crowded with text. You can do this with the command cls at the Windows command prompt and the command clear at the Unix/Mac command line. (Even after clearing the screen, you should be able to scroll up in your terminal windows to see what you’ve done in the past.)

Objectives

  1. To gain a basic familiarity with the command line.
  2. To install and use MALLET with the sample data included in the package.
  3. To reflect on the uses and limitations of topic modeling in historical research.
  4. To gain experience and confidence in following a detailed tutorial for an unfamiliar tool.

Requirements

There are both technical and non-technical requirements for this assignment, but the two parts are separable. I recommend that you attempt the technical part first since it will probably take longer, but if you get stuck, you should be able to answer the questions in the non-technical part before completing the techy stuff.

Technical Requirements

Complete the tutorial on Getting Started with Topic Modeling and MALLET at the Programming Historian, which will show you how to install MALLET and then use it on the sample documents included with the package.

This requirement will be completed when you tweet two screenshots of your work to the course hashtag #ricedh. More specifically:

  • One screenshot should, like Figure 8 in the tutorial, show the output of a train-topics command on the sample data set discussed in the tutorial, but should show that you generated 15 topics instead of the default 10.
  • One screenshot should, like Figure 10 in the tutorial, show a screenshot of the tutorial_composition.txt file generated by your 15-topic model opened in Excel. (If you don’t have Excel installed on your computer, you can also satisfy this requirement by creating a GitHub Gist containing the contents of your tutorial_composition.txt file and tweeting the link to the Gist instead.)

If you are not familiar with how to take screenshots on your computer, do some Googling to find out the answer, or ask on Twitter for help. You will also need to learn how to post photos on Twitter.

Non-Technical Requirements

After reading the Friday texts about topic modeling and trying out MALLET yourself, you should be able to figure out answers to the following two questions:

  1. Suppose we wanted to create a topic model of the runaway slave ads we have collected on our Google Spreadsheet. What first steps would we have to take to get from our spreadsheet of permalinks to a *.mallet file that we could train topics on?
  2. In his Mining the Dispatch project, Robert K. Nelson used MALLET to find articles that were likely to be fugitive slave ads in a large corpus of digitized newspapers. What feature(s) of the Portal to Texas History would have prevented us from using the same method to discover ads in the Telegraph and Texas Register? Be as specific and thorough as possible. (Here’s a hint: do some searching for keywords in the Telegraph and Texas Register on the Portal, and notice what kinds of results you get back. Does the kind of result returned by a keyword search tell you something about the way that the underlying text documents in the Portal are stored and separated from each other?)

Write up an email to me answering both of these questions. You should be able to answer them with just a few sentences in each case—no more than two good-sized paragraphs should do the job.

Summary and Evaluation

Successful completion of this assignment will include:

  • Two screenshots posted to Twitter to satisfy the technical requirements.
  • An email to me answering the two non-technical questions.

Because this assignment has several, separable parts, I will divide up the points for the assignment this way when evaluating your homework: two points for each screenshot, and three points for each answer in the email.

Help! I’m Stuck!

There is a good possibility you’ll encounter technical difficulties when doing this assignment. Don’t fret or bang your head against the wall all weekend if you are getting an error message that is not mentioned in the tutorial, or if you are having trouble getting the same results shown in the tutorial. Instead, get help!

You can always take to Twitter if you need help. If you are getting error messages in your terminal that are longer than 140-characters or difficult to explain, you can also use a Gist, as you did in the first homework, to get help. Copy and paste the strange output of your terminal into a Gist, putting an explanation of what produced it in the Gist "description," and then tweet the URL to that Gist to our course hashtag to see if I or another student can help. (And remember, helping out other students is a way to score well on the Team Participation part of your grade.)

Remember, though, the academic integrity policies for the course. Do not get someone else to do the work for you and be sure to acknowledge any pointers or technical assistance you received—in this case by noting it in your email to me.

Paper Machines Debriefing

I hope you enjoyed playing around with Paper Machines in our workshop with Jo Guldi. As promised, here’s a brief summary of how I constructed the corpus we used for our visualizations. I’ll follow that with some of the visualizations you made, and invite you to comment on what you see that’s of interest.

Continue reading

Jo Guldi at MITH

To learn more about the beginnings of Paper Machines and the uses of text mining and visualization for historians, you can check out Jo Guldi’s recent talk at MITH in Maryland:

Topic Modeling Workshop: Guldi and Johnson-Roberson from MITH in MD on Vimeo.