Author Archives: ctj1

Geoteam rough draft

 The method of close-reading runaway slave advertisements between 1835 and 1865 allows for an exploration of whether patterns of listed locations differ between the states, specifically in relationship to how Texas trends might differ. Various newspapers from Mississippi, Texas, and Arkansas provide the data set for this analysis. Trends are most easily analyzed by individual state, followed by a conversation and comparison of these overall trends between the states.

Spanning the years 1835 to 1865, the pattern of Arkansas’s runaway slave ads shifts with its relative position to other states. A territory until it reached statehood in 1836, Arkansas was the borderland of the United States for the earlier years between 1835 and 1865. Texas declared independence in 1836 and maintained its autonomy from the United States until 1845. Arkansas, then, was essentially a western borderland. The passage of the Mississippi River through Arkansas also allowed slaves the opportunity to escape by boat, as the mulatto Billy attempted when fleeing from New Orleans (AR_18360526_Helena-Constitutional-Journal_18360526).

Many jailer notices in Arkansas advertise captured slaves from more eastern states, indicating that Arkansas was a popular destination or point on the route to freedom. For example, in 1836 two slaves Jacob and Jupiter say “that they Belong to H. B. JOHNSON, residing in Yazoo county, Mississippi” (AR_18360705_Arkansas-Gazette_18360409). Similarly, the captured “Negro man” Henry claims his home is in Memphis, Tennessee, with a Mr. Staples (AR_18551123_Democratic-Star_18551123). Numerous other examples also support this trend.

In addition, many slaveowners from other states advertised for their runaways in Arkansas, indicating that they considered Arkansas a likely location for their runaways. George and James of Mississippi are advertised for in the 1838 Arkansas Gazette, in addition to re-publication of the advertisement in the Memphis Enquirer and Little Rock Gazette (AR_18380314_Arkansas-Gazette_18371002).

Although the westward movement seemed to be generally assumed among slaveowners, a handful considered family ties stronger, such as Martin Miller of Fayetteville, Texas, who advertised for his slave in the Arkansas Gazette: “Said Negro was brought from Georgia, and is probably making his way back to that State” (AR_18360909_Arkansas-Gazette_18360727).

With the passage of time, these trends shifted. Arkansas lost its “borderland” status to Texas. With these changes came a change in the fugitive slave advertisements. The number of runaways from Arkansas increased, probably due to a rise in population. The number of jailer’s notices advertising slaves who claimed to be from other states also increased, however, suggesting that Arkansas still served as a way station for slaves on their journeys to Texas or Mexico.

Despite the projection of locations onto their runaways, slaveowners acknowledged that these assumptions were just that – merely assumptions. An 1836 ad from the Arkansas Gazette states “I have dreamed, with both eyes open, that he went toward the Spanish county; but as dreams are like some would be thought honest men―quite uncertain―he may have gone some other directions.” Although most fugitive slave advertisements were slightly less flowery in their language, the inaccuracies of projected direction were subtly acknowledged in the advertisements.

Mississippi ads tend to be both jailer’s notices and runaways ads of and for slaves from Mississippi. This trend suggests that Mississippi, unlike Arkansas, was a more stable slave economy and not as frequently a destination for slaves.

Texas, the focus of this research, offers data from the Texas Telegraph and the Texas Gazette. William Dean Carrigan, in his article “Slavery on the frontier: the peculiar institution in central Texas” sets Texas up as “a world torn in three directions by four different cultures.” The Native American tribes and the Mexican border both helped to define Texas as a borderland. How this exhibited itself through the runaways, however, is still contested. Campbell states that runaways tended to head toward either Mexico (for freedom) or toward the east (to rejoin relatives that they had been separated from) but does not indicate which was more prevalent.

The extensive size of the data set results in certain implications based on the time-consuming and labor-intensive nature of the manual labor of close reading. When analyzing the data by the human eye, pre-conceived assumptions come into play, and unexpected results are less likely to be found if present. In digital analysis, however, unique results can be reached more easily through an unbiased re-organization of the data. Without digital tools to sift through the information and help identify patterns, the presence of human error in evaluating the advertisement trends is more likely to be present, especially based around expectations. Focusing on multiple elements or the connections between them is also more difficult. For example, perhaps there exists a correlation between the amount of the reward and the projected location of the slave or distance between the locations of the advertisement and the owner. Without the extremely labor-intensive process of creating a spreadsheet, this evidence is difficult to analyze. Specific locations (cities and plantations) fall to the generalization and recognizability of states and counties. With over 1000 advertisements in the Mississippi corpora alone, analysis and trends are very difficult to find in a short period of time.

Based on these observations, the borderland status of states does change the location trends present in runaway slave advertisements. The advantages of digital tools, however, will help us analyze these conclusions to evaluate the correlation between digital tools and close-reading, as well as possibly reveal unexpected patterns in the data set.
GeoTeam Schedule

Monday, March 31st

Split up Arkansas and Mississippi corpus into individual ad files using drsparser.py – Aaron

Write python script placetagger.py to tag places using Pyner in a folder of text files and save the results – Aaron

Tuesday, April 1st

Run placetagger.py on Arkansas, Mississippi, and Texas (Gazette and Telegraph) corpus – Aaron

Run placetagger.py on Mississippi corpus – Kaitlyn

Start looking over required readings from earlier in the semester for more information about trends in runaway destinations and connections among Texas, Mississippi, and Arkansas. Do additional readings if necessary – Clare

Wednesday, April 2nd – Friday, April 4th

Clean up Named Entity Recognitions results – Aaron and Kaitlyn

  • Remove false positives
  • As thoroughly as possible given the magnitude of the collection, scan through tagged documents for any obvious false negatives
  • Tag each tagged location as a to or from, projected or real

Look over our data and outline the essay – Clare

Test drive Palladio and research other mapping options for displaying our place connections results – All

Saturday, April 5th – Sunday, April 6th

Analyze Named Entity Recognition results – All

If a lot of NER results:

  • Research geocoding APIs to parse our NER results and generate latitude/longitude coordinates for all named places – Aaron
  • Write script to generate coordinates for tagged locations and execute on our data – Aaron

Else:

  • Manually search for and store coordinates – Kaitlyn

Draft the close reading essay – Clare

Write progress update for course blog – Aaron and Kaitlyn

Monday, April 7th – Tuesday, April 8th

Decide on how we want to display our place connectedness results – All

  • How to display our results? Lines connecting the “to” coordinates (e.g. projected destination) and the “from” coordinates (e.g. coordinates of Houston for the Texas Register)? Something more individualized, at the ad-level? Collapse lines between cities or even states into single weighted lines by the number of that connection?
  • Building onto the first question, how to indicate direction: different line shapes/colors? For example, if there is a Texas ad that says their runaway probably went to his family in Arkansas, how to we differentiate that from an Arkansas jailor notice for a runaway slave saying he is from Texas? Is it important at all for us to make this distinction? If not, we might do better with a map in the form of an undirected graph.
  • How to separate projected runaway “to’s” (and guessed “from’s” for jailor’s notices, if ads like that exist) from actual “to’s” and “from’s”? Do we have much more of one type (real. vs guessed) — probably almost exclusively guessed locations?

Wednesday, April 9th – Friday, April 11th

Coordinate analysis and clean up – All

Re-assess rest of semester schedule in light of presentation format choices – All

Choose a mapping tool. Start building our map based on our decisions about to, from, projected, etc – All

Saturday, April 12th – Sunday, April 13th

Discuss our overall findings, and how our graphs and/or interactive tools share this information – All

Write and post progress report on course blog (by Monday) – All

Monday, April 14th – Wednesday, April 16th

Begin Methods page – Aaron and Kaitlyn

Begin Conclusions page, including followup questions and summary of findings – Clare

Finish our map and other graphics – All

Thursday, April 17th – Sunday, April 20th

Write and post progress report – All

Finish Methods page – Aaron and Kaitlyn

Finish Conclusions page – All

Monday, April 21st – Friday, April 25th

Finalize website pages – All

Throughout, Clare will re-work the essay in light of any new info.

Historiographical Essay Rough Draft 2

Not much research has been done on slavery in Texas. John Hope Franklin and Loren Schweninger’s Runaway Slaves: Rebels on the Plantation, one of the most comprehensive projects on runaway slaves in the South, does not even include Texas in the data or analysis, but rather implies that slavery seems to be relatively universal throughout the South. Randolph B. Campbell opened the discussion of slavery in Texas through his book An Empire for Slavery: The Peculiar Institution in Texas, 1821-1865, but agreed with Franklin and Schweninger on the similarities across the country. William Dean Carrigan, however, took another position in the chapter on Texas in his book Slavery and Abolition: he argued that slavery in Texas (specifically in central Texas) was unique from that in other Southern states. However, the lack of information on the topic indicates the need for additional research in order to reach a more definitive conclusion.

Why would Texas be different from other states? Since Texas was the frontier of plantation agriculture, many diverse groups interacted with the slaveholders and their slaves. Mexicans (to the south) and Indians (to the north and west) increased owner fears and possibly runaway occurrences as well. The proximity of Mexico and the absence of a fugitive slave law there made it a more desirable runaway location than the North, which was still impacted by fugitive slave laws. The presence of Indian tribes just on the outskirts of the plantation culture provided another possible refuge for runaways. Although not all Indians were friendly to runaway slaves and although the proximity of Mexico did not necessarily result in increased runaway occurrences, both of these factors could have contributed to the culture of slavery in Texas. In addition the lower population density and wooded terrain of central Texas were possible advantages for runaways.

These factors not only framed the diversity of options available to runaways but also impacted slaveholders’ perceptions of their slaves. How did slaveholders react to the many runaway possibilities? Did they treat or perceive their slaves differently? Or were Texas slaveholders essentially the same as slaveholders in any other state? Runaway slave advertisements allow a glimpse into these perspectives through the language they use to describe the slaves. These advertisements were prevalent throughout the South prior to the Civil War, and are thus an important historical resource for historians. Our project will compare Texas advertisements (from the Houston Telegraph) with those from other states in order to contribute toward a more comprehensive view on slavery in Texas.

In order to accomplish this, we will utilize various digital tools. The term “digital history” addresses two different perspectives: using digital tools to discover new information and using the digital to present those findings. By exploring different methodologies, we may be able to benefit historians as a whole by contributing to future ways of working with data. In addition, we are interested in the digital presentation of history: what are the various benefits and disadvantages of each method? The basic essay format is only one of many ways of presenting information, and other genres provide unique perspectives on the same argument. These explorations will contribute to both the historical and the methodological in the context of Texas runaway slaves and the digital humanities, allowing our research to stretch beyond the specific into future possibilities of genre and method.

Historiographical Essay Rough Draft

Please comment!

Not much research has been done on slavery in Texas. John Hope Franklin and Loren Schweninger’s Runaway Slaves: Rebels on the Plantation, one of the most comprehensive projects on runaway slaves in the South, does not even include Texas in the data or analysis, but rather implies that slavery seems to be relatively universal throughout the South. Randolph B. Campbell opened the discussion of slavery in Texas through his book An Empire for Slavery: The Peculiar Institution in Texas, 1821-1865, but agreed with Franklin and Schweninger on the similarities across the country. William Dean Carrigan, however, took another position in the chapter on Texas in his book Slavery and Abolition: he argued that slavery in Texas (specifically in central Texas) was unique from that in other Southern states. However, the lack of information on the topic indicates the need for additional research in order to reach a more definitive conclusion.

Why would Texas be different from other states? Since Texas was the frontier of plantation agriculture, many diverse groups interacted with the slaveholders and their slaves. Mexicans (to the south) and Indians (to the north and west) increased owner fears and possibly runaway occurrences as well. The proximity of Mexico and the absence of a fugitive slave law there made it a more desirable runaway location than the North, which was still impacted by fugitive slave laws. The presence of Indian tribes just on the outskirts of the plantation culture provided another possible refuge for runaways. Although not all Indians were friendly to runaway slaves and although the proximity of Mexico did not necessarily result in increased runaway occurrences, both of these factors could have contributed to the culture of slavery in Texas. In addition the lower population density and wooded terrain of central Texas were possible advantages for runaways.

These factors not only framed the diversity of options available to runaways but also impacted slaveholders’ perceptions of their slaves. How did slaveholders react to the many runaway possibilities? Did they treat or perceive their slaves differently? Or were Texas slaveholders essentially the same as slaveholders in any other state? Runaway slave advertisements allow a glimpse into these perspectives through the language they use to describe the slaves. Through the utilization of various digital tools and comparison of the Texas advertisements (from the Houston Telegraph) with those of other states, we hope to contribute an additional facet to the debate on slavery in Texas.


Progress Report for Introductory Historiographical Essay

My project involves writing an introductory explication detailing the background of runaway slave research in Texas. After I finished re-reading the chapters by Campbell and Carrigan, I outlined a basic structure for the essay, included below:

  1. An introductory paragraph, including a hook to grab interest (comparison of descriptions of October 1835 slave rebellion by Campbell and Carrigan) and information about the work that has been completed on Texas up to this point
  2. Present a general overview of the argument that Texas is the same as other Southern states, then transition to a more specific focus on the spectrum of reactions to slavery (submission, rebellion, and somewhere in between).
  3. Categorization of various types of runaways (long term, toward family, to woods, habitual)
  4. Present a general overview of the argument that Texas is unique, addressing the issue of how it would differ (in its process or in the overall result). Introduce the central concept of Texas as a frontier on multiple levels (western frontier of plantation agriculture, surrounded by multiple cultures).
  5. Address the impact of the proximity of Mexico on slavery in Texas, discussing Mexico’s fugitive slave policy in contrast to that of the North, the increase of fears in slave holders, the slightly higher number of runaways (both from Texas and outside of Texas), and the impact of the prevalence versus the climate of slaves and slave holders
  6. Discuss Indian interaction with slaves, specifically the blessing and curse aspect of their relationship
  7. Touch briefly on the slave rebellions
  8. Specify that many of the arguments made were from the perspective of central Texas, and include information about the terrain, low population, and greater freedom of resource
  9. Carrigan’s conclusion of the process as different but not the outcome. Differences become more similar with increased military control and increase in white population. Overall, climate was different because slaves had increased opportunities for running away, and thus had more leverage with their owners.
  10. Possible causes and differences discussed in class, such as Texas before and after its entrance into the Union
  11. Conclusion: more research is necessary on runaways in Texas

The structure may change slightly after writing it. Currently, I do not envision using many specific examples and will probably focus on generalizations. I plan on completing a rough draft of the background information by Wednesday, but in the meantime, I would appreciate any comments or suggestions on my current outline!

Digital Mapping with Time Features

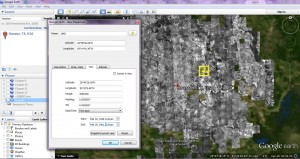
After completing the tutorials for the geographical digital tools, Kaitlyn and I decided that change across time was an essential element of a mapping tool for our project with runaway ads. Google Fusion, although interesting and relatively accessible as far as understanding, does not fulfill those needs. Our primary focus, then, has been on Google Earth. Enabling “Historical Imagery” under “View” creates a timeline with slider from 1943 to 2014 of the map imagery at a given time. Our next concern, then, was how we ourselves could insert time-specific data into Google Earth. In the “Properties” of a placemark under the “View” tab, there is an option under Date/Time for Time span and Time stamp.

We inserted two placemarks with different time spans in order to test the feature. Although the movement of the time slider seemed to acknowledge the fact that the span of years was between 1960 and 1965, the markers did not disappear when the time span was absent. Our primary problem, then, is in trouble-shooting this problem, since the feature itself seems to represent something we could use as far as time span data.

Andrew suggested a more computer-science based option through KML and the use of programming and coding in order to possibly diagnose the error. In addition, while searching for assistance with Google Earth time span, I discovered a digital humanities document from UCLA on the topic that seems like it could be of assistance. It seems to be relatively step-by-step but  my limited knowledge of programming has left me confused with how to work with this possible option.

Issues with Google Earth: it tends to crash or malfunction with relative frequency, which I have learned through previous path tracking work with it. For this reason, it would be more beneficial to find a tool that specializes in mapping over time, since the many features and possibilities are not necessary for our project and probably exacerbate the issue of frequent crashes.

One question that we would need to answer about our project is whether we want to map using regions or points. Regions would indicate frequency of runaways from a given area, or likelihood/projection of the owners on where their runaways have fled. A map of this sort would provide multiple layers of information about runaways: how likely they were to run away at a given time and how high runaway rates were in certain areas (if we wanted to focus solely on the latter question, we could probably use Google Fusion as our tool.)  A map with placemarks could easily become overcrowded with pinpoints. Although this problem could be solved through different color-coding techniques, any advantages of placemarks would be removed through getting rid of the specific location. Therefore, region-based mapping (around county, possibly?) seems to be the best option as far as runaway ads. Our data set would have to be examined in order to determine whether the information it provided would allow for such a system.

Today in class, we will possibly research the basic KML scripts that seem to be necessary for functioning of the Google Earth time span. With assistance, maybe we will be able to start working with the basic coding language using the steps from the UCLA document. We will also explore the timemapper option suggested by Dr. McDaniel over Twitter, in addition to neatline, a website that Kaitlyn was planning on exploring.  Once we determine whether or not these options are feasible for us, we will compare the possible time mapping tools and discuss their pros and cons in relationship to our particular topic of runaway slave ads and our specific data set.